“One thing about cold weather: it brings out the statistician in everyone.”[i]
If you’re reading this, it probably means that you’ve read and seen other reports, articles, stories and such about the rolling blackouts and other emergency measures that the Electric Reliability Council of Texas (ERCOT), the Southwest Power Pool (SPP), and the Midcontinent Independent System Operator (MISO) were forced to institute at one time or another last week. What follows is some information on ERCOT which has received the most attention because it had such severe problems (e.g., 4 million people without power and 80 dead). We will be doing a piece on SPP and MISO in the coming days. Their generation mixes are different than ERCOT’s.
What failed in ERCOT and what happens going forward will be examined over the coming weeks. FERC and NERC have announced a joint inquiry, and the Senate Energy Committee and House Energy and Commerce Committee, along with the Texas legislature and Texas Public Utility Commission, have announced their intention to hold hearings.
Since America’s Power focuses on the nation’s fleet of coal-fired power plants, we thought it made sense for us to provide some data about the fleet’s role in ERCOT.
ERCOT LAST YEAR
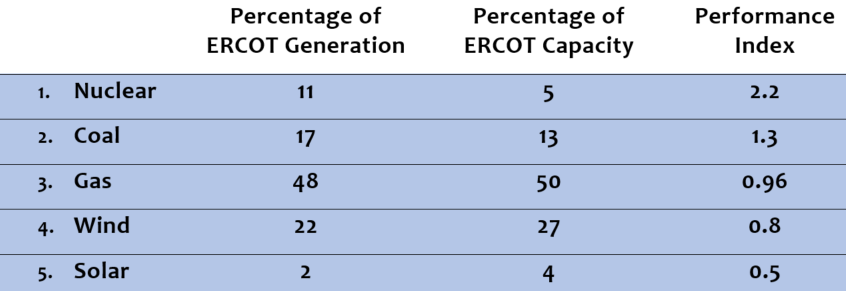
In 2020, ERCOT had approximately 104,500 megawatts (MW) of installed electric generating capacity.[ii] Natural gas represented slightly more than half of this capacity (52,800 MW), wind 27 percent (27,000 MW), coal 13 percent (14,000 MW), nuclear 5 percent (5,000 MW), and solar 4 percent (4,200 MW).[iii] (These numbers are rounded.) ERCOT’s coal fleet reached its maximum capacity of 19,700 MW in 2014. Since that time, 11 coal-fired generating units representing 6,200 MW of capacity have retired.
In terms of electricity generation, natural gas provided almost half (48 percent), wind 22 percent, coal 17 percent, nuclear 11 percent, and solar 2 percent. Together, dispatchable resources were responsible for almost 60 percent of ERCOT’s electricity generation. The table below compares the capacity and generation contribution of each electricity source. Electricity production (MWh) from both nuclear and coal exceeded their generating capacity (MW). Nuclear represented 5 percent of capacity but contributed 11 percent of ERCOT’s electricity supply; coal represented 13 percent of capacity and contributed 17 percent of supply.[iv] In other words, nuclear and coal overperformed, that is, their performance index (percentage of generation ÷ percentage of capacity) was greater than 1.0.
WEATHER EMERGENCIES
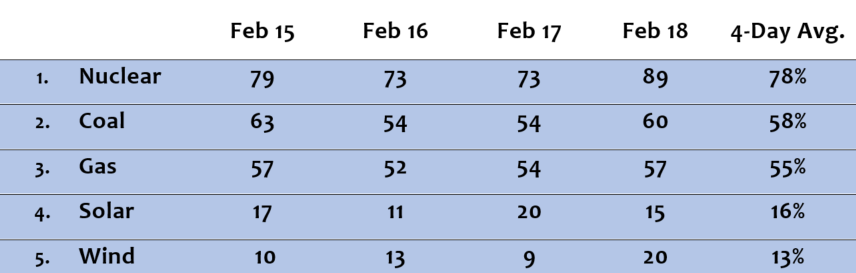
The table below compares the performance of natural gas, coal, nuclear, wind, and solar over the four-day period when electricity demand spiked in ERCOT. The table shows the percentage of each resource’s installed generating capacity that was operating on each of the four days. Nuclear (78 percent) performed best, followed by coal (58 percent), natural gas (55 percent), solar (16 percent), and wind (13 percent).
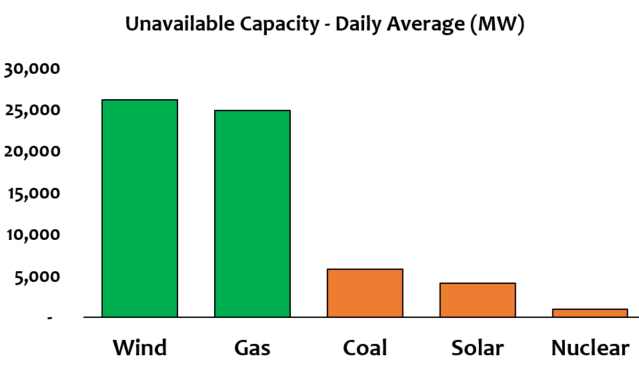
The bar chart below shows the average daily generating capacity that was NOT available for each resource, which is the difference between installed capacity and capacity that was operating. Wind and gas together had an average of almost 51,000 MW of capacity (26,100 MW of wind and 24,800 MW of gas) that did not produce electricity and approached 53,000 MW (27,300 MW of wind and 25,300 MW of gas) on February 17. One way to put this into perspective is to consider that ERCOT’s peak demand reached 65,300 MW on February 15 before it was forced to initiate load shedding. Coal averaged 5,800 MW of unavailable capacity, solar 4,130 MW, and nuclear 990 MW
ENERGY PRICES
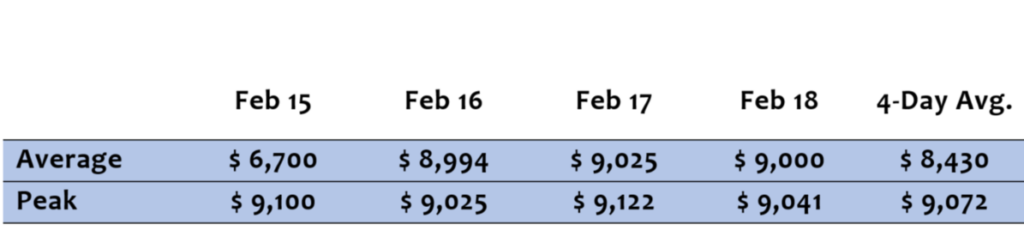
Power prices (table below) spiked during the four-day period, averaging $8,430/MWh, whereas prices averaged $27/MWh the first week of February.
Gas prices also spiked. Prices averaged $151.97/MMBtu over the four-day period, hitting $338.75/MMBtu on February 17. Gas prices the first week of February averaged $2.83/MMBtu and were as low as $2.68/MMBtu.
Since there are a number of inquiries into the ERCOT weather emergency, we decided not to offer any conclusions yet. Rather, we decided to let these numbers speak for themselves for the time being. However, extreme weather events in CAISO, ERCOT, SPP, and MISO are a harsh reminder that reliability and resilience are of paramount importance as the nation’s electricity grids reduce their reliance on dispatchable and fuel-secure resources like the coal fleet.
[i] Paul Theroux, American travel writer and novelist.
[ii] The data in this paper were provided by Energy Ventures Analysis and are based on publicly available information.
[iii] These installed capacities do not necessarily mean that this much electric generating capacity is always available. In particular, the firm capacity contribution of wind is only 7,300 MW (27 percent of its installed capacity) and solar is only 344 MW (approximately zero percent).
[iv] ERCOT’s electricity generation totaled 369,000 GWh in 2020. Gas (combined cycles, combustion turbines, and steam turbines) generated 178,000 GWh, wind 74,800 GWh, coal 64,600 GWh, nuclear 40,800 GWh, and solar 8,200 GWh.