The coronavirus outbreak is doing enormous damage to small business, and it’s also affecting major industries that are the cornerstones of the U.S. economy. One of those industries is the nation’s fleet of coal-fueled power plants that provide electricity to consumers in 47 states. March was the first month during which coronavirus caused significant economy-wide disruption. What effect did that disruption have on the coal fleet?
To answer that question, we compared data from March 2020 to data from March 2017-2019 for PJM and MISO, two electricity grid operators whose multi-state footprints encompass about half the U.S and half the nation’s coal fleet. We picked a three-year period to avoid having one unusual year bias the comparison. Below is a summary of what we found when we compared the two time periods.
Electricity demand dropped.
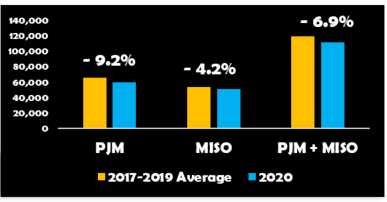
PJM and MISO are the two largest Independent System Operators (ISOs) in the country, together covering all or part of 23 states and DC. Both ISOs maintain readily accessible databases. These data show that electricity demand in March of this year was down 9.2% in PJM and 4.2% in MISO, compared to March 2017-19. The combined drop was almost 7%.[i]
Change in Electricity Demand (% and GWh)
Coal-fired electricity generation fell dramatically.
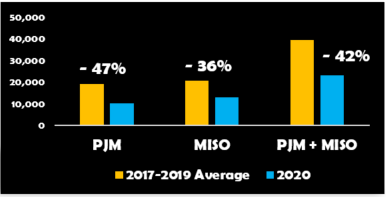
PJM and MISO have the two largest coal fleets (121,000 MW) of all the grid operators. March 2020 electricity produced by coal dropped dramatically. PJM coal-fired generation declined by 47%, and MISO declined by 36%. The combined drop was nearly 42%.
Change in Coal-Fired Generation (% and GWh)
Low natural gas prices had a major effect on coal-fired generation.
The market price for coal was approximately 5% lower in March 2020 than March 2017-19. For natural gas, the decline was much more dramatic. Gas prices fell nearly 37% nationally, 48% in PJM and 44% in MISO.[ii] These unusually low gas prices caused an increase in electricity generation from natural gas-fired power plants, which displaced coal-fired generation. Electricity generation from natural gas was 31% higher in PJM and 24% higher in MISO.
Rail shipments of coal declined.
The vast majority of coal is shipped from mines to power plants by freight rail. In March 2020, these shipments fell by nearly 15% over the same period in 2019.[iii] The decline in coal shipments was the largest of any freight rail category, although coal still accounted for more than one-fourth of the rail industry’s carloads. Total freight rail volume in March 2020 declined by 6%.
Sensible policies are needed.
The coal fleet and its supply chain are regarded by the Department of Homeland Security as critical infrastructure because electricity is essential to the operation of just about everything we rely on. However, coronavirus has created a new challenge for the coal fleet and its suppliers.
We need the coal fleet not only during this crisis but also when the economy recovers because it is more reliable, resilient, and fuel secure than almost every other source of electricity. In addition, the price of coal is stable, whereas the price of natural gas, a major source of electricity, often increases dramatically in the winter.
Despite these advantages, 40 percent of the coal fleet has retired or is expected to retire. Sensible policies are needed to ensure the coal fleet can continue providing electricity. For example, the Federal Energy Regulatory Commission and grid operators need to value the resilience and fuel security attributes of the coal fleet the same way essential reliability services are valued now in power markets. Public utility commissioners should take the loss of these attributes into consideration when coal retirement decisions are being evaluated. And, it’s time to end the exorbitant support for renewable sources of electricity that have received more than $100 billion in subsidies for the past four decades.[iv]
[i] Load and generation data cited here was compiled from queries at the ISO websites, https://pjm.com/markets-and-operations/data-dictionary.aspx and https://www.misoenergy.org/markets-and-operations/real-time–market-data/market-reports
[ii] Market price data are queried from S&P Global Market Intelligence. Henry Hub natural gas prices are used for national prices, Chicago Citygate for MISO prices, and TETCO M3 for PJM natural gas prices.
[iii] Data is compiled from weekly freight rail traffic reports of the American Association of Railroads (weeks 10-13), available at https://www.aar.org/data-center/.
[iv] Congressional Research Service (CRS): “Energy Tax Policy: Historical Perspectives on and Current Status of Energy Tax Expenditures,” Report for Congress R41227, May 2, 2011; “Energy Tax Incentives: Measuring Value Across Different Types of Energy Resources,” Report for Congress R41953, March 19, 2015; “Energy Tax Policy: Issues in the 114th Congress,” Report for Congress R43206, June 15, 2016; “The Value of Energy Tax Incentives for Different Types of Energy Resources: In Brief,” Report for Congress R44852, May 18, 2017; and “The Value of Energy Tax Incentives for Different Types of Energy Resources,” Report for Congress R44852, Updated March 19, 2019.