China Will Gain Billions from U.S. Solar Tax Credits
President Biden wants to decarbonize the electric power sector by 2035, with an interim goal of 80 percent carbon-free electricity by 2030. Meanwhile, the U.S. electricity supply will be 50 percent carbon free by 2030 without any new and expensive policy mandates.[i] Achieving the President’s goals would require adding massive amounts of new wind and solar power to the nation’s electricity grid at a cost of more than $1 trillion.[ii] In addition, there are questions whether the electricity grid can be as reliable as it needs to be because wind and solar cannot always supply electricity when needed.
The House passed its version of the Build Back Better Act that would extend tax credits for wind and solar projects for another 10 years. These tax credits provide a financial incentive to build and operate wind and solar installations. This would be the 25th time these credits have been extended despite the fact that they are costly to taxpayers (at least $100 billion for the proposed tax breaks) and are no longer necessary to expand wind and solar power.
But there is another concern: China will be the biggest winner from the expansion of U.S. solar power resulting from these tax credits. This is because China controls the global production of solar photovoltaic (PV) components that are the backbone of solar power in the U.S., as well as in other countries.[iii]
U.S. Solar Power
PV cells are the predominant technology for converting solar energy into electricity. According to EIA, utility-scale solar PV generating capacity in the U.S. totaled 48,500 megawatts (MW) last year, or slightly less than 5 percent of total generating capacity. Solar PV is projected to grow steadily even without tax extensions. This year alone, new solar projects are expected to total 44,000 MW.[iv] By 2030, solar PV capacity is projected to total more than 175,000 MW, or 14 percent of U.S. electric generating capacity. To put this in perspective, the projected increase in solar generating capacity by the end of this decade—even without tax extensions—is roughly equivalent to the combined electric generating capacity of Indiana, Kentucky, Ohio, Pennsylvania, and West Virginia.[v]
Preliminary analysis suggests that utility-scale solar PV could increase by an additional 397,000 MW by 2030 as a result of the proposed tax extensions.[vi] If correct, this would require a capital expenditure in the range of $397 billion for new utility-scale solar PV installations.[vii] Because of its dominance in the solar PV supply chain, China can be expected to reap major economic benefits from such a large expansion of solar power in the U.S.
China’s Grip on Solar[viii]
China currently has 1,080,000 MW of coal-fired generating capacity—more than half the world’s coal-fired capacity. In addition, China has 97,000 MW under construction and another 167,000 MW planned.[ix] By comparison, the U.S. coal fleet totals 220,000 MW, about one-fifth the size of China’s coal fleet. China burned more than 3 billion tons of coal last year, roughly half of all global coal production, whereas the U.S. burned 477 million tons.
In addition, China has 180,000 MW of utility-scale solar PV, almost four times more than the U.S.[x] Most of this solar is manufactured in China, which is the world’s leading producer. Last December, China announced a new goal to expand wind and solar capacity to more than 1,200,000 MW (compared with 535,000 MW last year).
Solar PV
The solar PV manufacturing chain involves five components that are produced in the following order: polysilicon, ingots, wafers, cells, and modules (or panels).[xi] Chinese companies dominate every segment of this manufacturing chain.[xii]
Polysilicon
China currently produces 80 percent of the world’s polysilicon, which is the feedstock for manufacturing solar PV. However, China could be responsible for 90 percent of polysilicon output within the next few years.[xiii] Since 2017, more than 90 percent of new polysilicon processing capacity has been built in China. Seven of the world’s top 10 polysilicon producers in 2020 were Chinese.[xiv] Low-cost electricity generated by China’s enormous coal fleet is a competitive advantage because electricity accounts for slightly more than 40 percent of the cost of making polysilicon. Moreover, market consolidation is expected to favor Chinese companies even more.
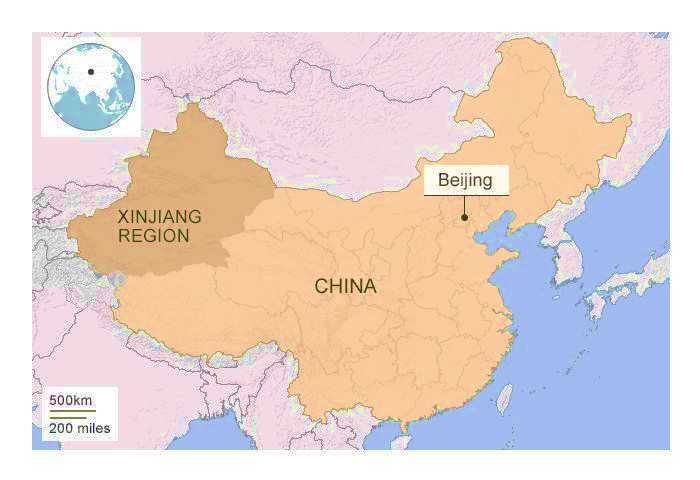
Roughly half the world’s supply of polysilicon comes from China’s Xinjiang region (map below), where, according to humans rights groups, the U.S. and U.K., Uyghur Muslims have been subjected to forced labor, torture, other human rights abuses, and genocide.[xv]
Ingots, Wafers, and Cells
China produces 98 percent of the wafers and ingots used in solar panels.[xvi] China has 227,000 MW of wafer manufacturing capacity; the rest of the world has 18,000 MW. According to Bloomberg, “[China] having control over wafer manufacturing has been critical on its path to global dominance of the PV supply chain.” Nine of the top 10 wafer manufacturers are based in China. Costs and other hurdles make it difficult to build new wafer factories outside of China.
More than 80 percent of new cell manufacturing capacity is being built in China. The U.S. has added no new cell capacity since 2009. China-based companies were responsible for 78 percent of global cell manufacturing in 2019.
Modules / Panels
Chinese firms supply three-fourths of the world’s solar panels, whereas the U.S. produces 1 percent.[xvii] Chinese panel manufacturing capacity for 2021 is projected to be almost 299,000 MW, some 70 times greater than the U.S. capacity of 4,200 MW.[xviii] China has 261 manufacturing facilities, whereas the U.S. has 16.[xix] Most U.S. solar installations use modules manufactured at plants in Vietnam, Malaysia and Thailand that are owned by Chinese firms. (The terms modules and panels are used interchangeably in the solar industry.)
Summing Up
This paper has lots of numbers, but we thought they were necessary to convey the grip that China has on the solar PV market. The table below sums up China’s dominance at each step of the manufacturing chain:
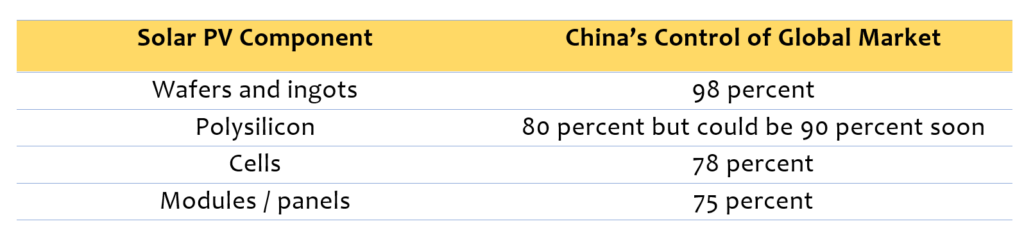
The U.S. is a relatively minor player in solar PV manufacturing, which is why China stands to reap huge economic benefits from the solar PV capacity resulting from extension of the tax credits for solar. As BloombergNEF put it earlier this year, “For another country to keep up with Chinese PV output, a network of industries would need to be significantly expanded or built from scratch. Even still, it is unclear whether these new factories could be cost-competitive against China.”
November 2021
[i] AEO 2021 reference case for 2030. Renewables and nuclear are projected to supply 50.7 percent of U.S. electricity in 2030.
[ii] A number of independent studies (Princeton, EPRI, Energy Innovation, S&P Capital, etc.) have estimated that decarbonizing the U.S. electricity supply would cost $1 trillion or more. One study estimated a cost of $4.5 trillion. All of these studies project the addition of very large amounts of carbon-free resources, mostly wind and solar. Collectively, the projections indicate the need for roughly 1 million MW of new wind and solar capacity.
[iii] “Testimony before the House Committee Energy & Commerce, Energy and Environment Subcommittees, Ethan Zindler, Head of Americas, BloombergNEF,” November 16, 2021.
[iv] “S&P projects record installation of 71 GW of US wind and solar in 2022 amid rising headwinds,” Emma Penrod, Utility Dive, November 15, 2021.
[v] EIA, “State Electricity Profiles,” November 4, 2021. https://www.eia.gov/electricity/state/
[vi] Energy Ventures Analysis estimates an additional 397,000 MW of solar PV will be added by 2030 if the tax credits for solar are extended another 10 years.
[vii] Lazard 14.0 (2020) gives a range of $825-975/kW for utility-scale solar PV. AEO 2021 gives an estimate of $1,248/kW. For simplification, we assume a cost of $1,000/kW.
[viii] Unless otherwise noted, most of the information and data in this section of the paper has been taken from “Solar PV Trade and Manufacturing,” BloombergNEF, February 2021, and “Testimony before the House Committee Energy & Commerce, Energy and Environment Subcommittees, Ethan Zindler, Head of Americas, Bloomberg NEF,” November 16, 2021.
[ix] BBC, “How China shapes the world’s coal,” Catherine Early, November 2, 2021. https://www.bbc.com/future/article/20211028-how-chinas-climate-decisions-affect-the-world
[x] IEA, “An Energy Sector Roadmap to Carbon Neutrality in China,” September 2021.
[xi] See, for example, “Solar Photovoltaic Manufacturing Basics.” https://www.energy.gov/eere/solar/solar-photovoltaic-manufacturing-basics
[xii] “Testimony before the House Committee on Energy & Commerce Energy and Environment Subcommittees,” Ethan Zindler, BloombergNEF, November 16, 2021.
[xiii] Solar Power World, “No avoiding it now: Soon the Top 4 polysilicon manufacturers will be based in China,” Kelly Pickerel, May 12, 2021.
[xiv] The top 10 were Tongwei (China), Wacker (Germany/United States), Daqo New Energy (China), GCL-Poly (China), Xinte Energy (China), Xingjiang East Hope New Energy (China), OCI (South Korea/Malaysia), Asia Silicon (China), Hemlock (United States), and Inner Mongolia Dongli Photovoltaic Electronics (China). See endnote xiv above for source.
[xv] “Addressing Forced Labor Concerns in Polysilicon Produced in Xinjiang,” Nico Tsafos, Center for Strategic and International Studies, June 7, 2021. The Hill, “China’s Crimes Against the Uyghurs,” Naomi Kikoler, November 24, 2021. BBC News, “Who are the Uyghurs and why is China being accused of genocide?,” June 21, 2021. https://www.bbc.com/news/world-asia-china-22278037 Map taken from the same BBC article.
[xvi] Ibid.
[xvii] “How China Beat the U.S. to Become World’s Undisputed Solar Champion,” Bloomberg, June 4, 2021.
[xviii] Ibid.
[xix] Ibid.